
PC sensor panel for a second screen
Xenon is a free dashboard for the screens next to your PC. Its System tile shows CPU, GPU, RAM, disk and network readings with live graphs, plus the real frame rate inside games. This page lists what each card shows, where the readings come from on Windows, Linux and macOS, and what needs an extra install.
Last updated: 27 September 2026
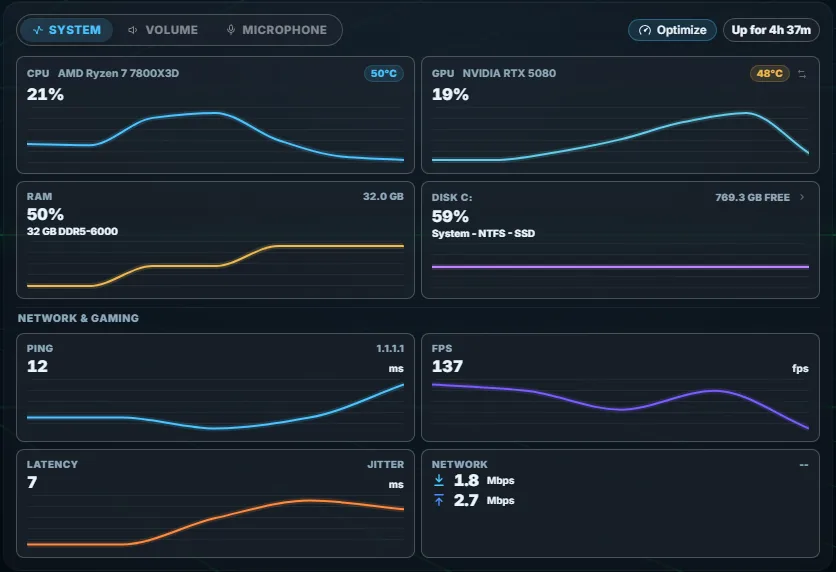
The System tile
The tile's System view holds eight cards: four for the machine and four under Network & Gaming. You can hide, reorder and resize the cards. On the CORSAIR Xeneon Edge's 2560×720 screen the tile shares the short height between its cards so all of them stay in view, and on a taller screen it fills the space.
- CPU. Load in percent, the processor model, and its temperature in the card's header.
- GPU. Load in percent or, with one tap, video memory in use, plus the temperature. The video memory switch only appears when the card reports its memory.
- RAM. Percent in use, used and total. On Windows it also names the memory type, speed, module layout and part number when Windows reports them.
- Disk. Percent used, free space, and the drive's name, file system and type. With more than one drive, an arrow steps through them.
- Ping. The average of three pings to 1.1.1.1, in milliseconds.
- Latency. The jitter: the gap between the fastest and the slowest of those three pings.
- FPS. The frame rate of the game you are playing, explained below.
- Network. Download and upload speed right now, added up across the physical network adapters.
Every card except Network draws a line through its last 40 readings, so a spike stays visible after it has passed. The header shows how long the PC has been on.
The CPU, GPU, RAM and disk cards update every 5 seconds. Settings → Performance → Sensor refresh rate can raise that to 2 seconds or 1 second. Each step reads the hardware more often, and the setting says what that costs on a PC that is also running a game.
The four Network & Gaming cards update every 3 seconds while the System view is on screen.
Temperatures show in °C or °F, following the Temperature unit setting. The choice reaches the CPU and GPU headers and the heat alerts, not only the weather. The History charts stay in °C.
Real in-game FPS
On Windows the FPS card reads PresentMon, which the setup downloads into Xenon's folder. PresentMon counts the frames a game hands to Windows through event tracing, so it also measures exclusive full-screen games. It needs the administrator rights the setup asks for.
Without PresentMon, Xenon falls back to a reading from the Windows desktop compositor, which only works for windowed and borderless games. With PresentMon, the card shows N/A instead of a number when no game is running.
With frame generation on, the card follows the frames your screen actually shows, where PresentMon reports them, so it agrees with other FPS overlays rather than showing the higher count of frames handed over.
On Linux the frame rate comes from MangoHud, for games launched with it (mangohud %command% as a Steam launch option). macOS has no frame rate source, so the card stays empty there.
Temperatures on Windows
On Windows the sensors are read by small PowerShell scripts (cpu-temp.ps1, gpu.ps1, network.ps1) that run inside one long-lived process, pwsh-worker.ps1. Reading them every few seconds therefore does not start a new process each time.
| Reading | Where it comes from | What you need |
|---|---|---|
| CPU temperature, clock and watts | Where it comes fromLibreHardwareMonitor | What you needInstalled by the setup with the PawnIO driver. Needs administrator rights. |
| Motherboard, AIO and power supply fans | Where it comes fromLibreHardwareMonitor | What you needInstalled by the setup with the PawnIO driver. Needs administrator rights. |
| NVIDIA GPU load, temperature, video memory, watts and clocks | Where it comes fromnvidia-smi | What you needNothing to set up. Xenon finds it when it is on the PC. |
| AMD and Intel GPU temperature, video memory, watts and clocks | Where it comes fromLibreHardwareMonitor | What you needInstalled by the setup. |
| Each graphics card fan, in RPM | Where it comes fromLibreHardwareMonitor | What you needInstalled by the setup. |
| GPU load without nvidia-smi | Where it comes fromWindows performance counters | What you needNothing. |
| CPU load, RAM, disks, network and ping | Where it comes fromThe system itself | What you needNothing. |
| In-game FPS | Where it comes fromPresentMon | What you needDownloaded by the setup. Needs administrator rights. |
LibreHardwareMonitor and PawnIO are installed through winget, so their files come from their own developers through Microsoft's package manager. PawnIO is a signed driver. Xenon has never shipped WinRing0, the older driver behind most hardware-monitoring antivirus warnings.
The driver only loads with administrator rights. If you said no to the Windows prompt during setup, the fan and watt readings stay empty and the CPU temperature can be missing. The Fans and Energy widgets then show an Enable sensors button: one Windows prompt sets Xenon's startup task to run with administrator rights from then on, and Xenon restarts. If the sensors are still empty after that, the widget asks you to restart the PC. The same button is in Settings → Performance → Hardware sensors.
Without LibreHardwareMonitor, Xenon falls back to the thermal zone temperature Windows reports, when the board provides one. A reading that is not available is left blank or shown as --, rather than as a made-up zero.
Temperatures on Linux and macOS
Xenon on macOS and Linux is in beta. The dashboard is the same as on Windows. What differs is how the machine is read: each system has its own collector that returns the readings in the same shape, so the tiles do not change.
| Reading | Linux | macOS |
|---|---|---|
| CPU temperature | LinuxThe kernel's own sensors (k10temp on AMD, coretemp on Intel). Nothing to install. | macOSThe Xenon Helper, which the installer fetches, with no administrator password. macmon is the fallback. |
| GPU load and temperature | LinuxNVIDIA needs nvidia-smi. AMD is read from the kernel. Intel load is measured from time spent out of the deepest sleep state, and Intel temperature only appears on chips with a sensor. | macOSThe Xenon Helper, which the installer fetches, with no administrator password. macmon is the fallback. |
| Fan speeds | LinuxEvery fan the kernel publishes. Most desktop boards need lm_sensors to load the right module. | macOSNot available. |
| CPU and GPU watts | LinuxNot read. | macOSNot read. |
| In-game FPS | LinuxMangoHud, for games launched with it. | macOSNot available. |
| Game mode | Linuxxprop, from the x11-utils package. On sway and Hyprland, their own IPC. | macOSThe Xenon Helper. |
If a tile stays empty, run npm run doctor in the install folder. It reads the machine the way Xenon does and prints what works, what your hardware simply does not expose, and what is broken. It changes nothing on the computer.
Fans, Energy, Batteries and Disk space
Four more tiles in the System group of the + palette, for when the System tile is not enough.
Fans
The speed of every fan the PC reports. On Windows the fans are grouped by where they sit: motherboard, hub or AIO, graphics card and power supply. Each fan on the graphics card is read from its own tachometer, so a card in zero-RPM mode shows its fans stopped. AIO coolers and fan hubs such as NZXT Kraken and Aquacomputer Octo are read too.
A motherboard only knows "Fan #3", so you can tap a name and rename it. A fan on an unsupported hub, such as iCUE Link, or on a splitter cannot report, and the widget says so. The Fans widget works on Windows and Linux, not on macOS.
Energy
The live draw of the CPU package and the GPU, in watts. With a CORSAIR HXi or RMi power supply connected over USB, it also shows what the whole PC draws, measured by the supply. That figure is the supply's output, not the reading at the wall socket.
Home Assistant power sensors, such as solar production or a smart plug, can sit next to the PC readings. The PC readings are Windows only.
Batteries
The charge of paired Bluetooth devices, of a laptop battery or a USB-connected UPS, which also says whether it is charging, and of CORSAIR mice, keyboards and headsets through iCUE while the RGB bridge in Settings → Lighting is on. Devices that go to sleep fade out instead of freezing on an old number. Windows only.
Disk space
What fills your drives, from a live file index rather than a scan button: a map you tap through, the largest files, duplicates verified byte for byte, and a closed list of categories that are safe to clean, such as temporary files and package caches. Everything else shows its size and has no delete button.
A cleanup moves files to the Recycle Bin or the Trash, so it can be undone. The one exception is emptying the Bin itself, which says so before you confirm. On Windows and macOS the index runs in the Xenon Helper, which the installer fetches. On Linux Xenon builds the index itself.
Sensor history and Guardian
Turn on Sensor history in Settings → Performance and the System tile gains a History tab. It charts CPU and GPU temperature and load, and RAM use, over the last 24 hours, 7 days or 30 days, with the latest value and the peak marked on each chart. It is off by default and needs no AI.
Xenon takes one reading every five minutes. It keeps hourly figures for 3 days and daily figures for about 3 months, in a file on your PC. The 24-hour view uses the hourly figures, the 7-day and 30-day views the daily ones.
The same tab shows PC Screen Time: your most-used apps over the period, total active time and how much of it was gaming. With history on, the Energy widget also charts the last 24 hours of CPU and GPU draw.
Guardian is the AI side of the same history, one of the optional Advanced AI features in Settings → Xenon AI. Ask "how is my PC doing?" and it analyses the history. With Guardian on, a notice also appears when the CPU reaches 90 °C, the GPU 88 °C or RAM 95%, at most once every 30 minutes for each.
Game mode and Performance Mode
Game mode is on by default. When a game runs full screen, the animated background and the AI glow pause, so the dashboard stops competing with the game for the GPU. They come back when you leave the game.
It watches the window in front, not frame rates: a full-screen window with no title bar counts, while maximised desktop apps, the dashboard itself and iCUE never do. On Windows it needs no extra tools and no administrator rights.
Performance Mode is opt-in, in Settings → Performance. Manual mode acts only when you press Optimize on the System tile or Optimize now in Settings. Suggest mode offers it when a game starts, or another activity you pick. Automatic applies it by itself and restores when the activity ends, but closing apps always waits for you. Each step is your choice:
- pause the dashboard's animations;
- switch Windows to a high-performance power plan;
- give the app in front an AboveNormal priority boost;
- close the background apps you pick, asking them to close rather than killing them, and always refusing critical Windows processes.
Restore puts back the previous power plan, the priority and the closed apps, even after a restart. The power plan and the priority boost are Windows features.
The Pause heavy tiles while gaming option, on by default, also stops the Browser, Second screen and Cameras tiles streaming while a game runs or an optimization is active.
Questions
Do I need AIDA64 or HWiNFO?
No. Xenon reads the sensors itself: through LibreHardwareMonitor, nvidia-smi and PresentMon on Windows, the kernel's own sensors on Linux, and the Xenon Helper on macOS. The Windows setup installs LibreHardwareMonitor and PresentMon for you.
Why is the CPU temperature missing?
On Windows this usually means Xenon runs without administrator rights, so the sensor driver cannot load. Press Enable sensors in the Fans or Energy widget, or in Settings → Performance → Hardware sensors, and accept the Windows prompt. If LibreHardwareMonitor is not installed at all, run INSTALL.bat in the Xenon folder again and accept the prompt.
Can I show the sensors on a Xeneon Edge?
Yes. The System tile shares the height between its cards so all of them fit on the Edge's 2560×720 screen. The same dashboard also runs on any monitor, a tablet, or a phone paired over your Wi-Fi, which is in beta.
Can I design my own sensor panel?
Yes, with the Widget SDK, which is in beta. Once you approve its access to the system readings, a widget can read load, temperatures, clocks, fan speeds, watts and FPS, including values the System tile does not show. The Create page is where to start.
Does it work on macOS and Linux?
Yes, both in beta. CPU and GPU temperature and GPU load work on both. Fan speeds, and in-game FPS through MangoHud, work on Linux but not on macOS. CPU and GPU watts are read on Windows only.
Download Xenon
Free, with no account. Download Xenon for Windows, or pick your system on the download page. To look around first, try the demo in your browser.